How We Fixed a One-Core Packet Processing Bottleneck in Torrust Tracker
We investigated a one-core softirq hotspot in the Torrust Tracker demo, ran isolated HTTP/3 and RPS/RFS experiments, and documented why better CPU distribution did not fully solve overall host load.

TL;DR
We found a production bottleneck where one CPU core was saturated by kernel packet work (softirq) while other cores still had spare capacity.
Current Load Snapshot
To keep this report actionable, we also captured a fresh live sample from the server while the service stayed healthy.
echo "=== uptime ===" && uptime && echo "=== cpu ===" && mpstat -P ALL 1 1 && echo "=== memory ===" && free -hLatest observed values:
- Load average:
11.71 / 11.91 / 11.48(also sampled at12.16 / 11.99 / 11.50) - CPU2 softirq:
48.48% - All-CPU softirq:
29.63% - All-CPU idle:
18.52% - Memory available:
27 GiBof30 GiB
This reinforces the same conclusion: the packet-processing hotspot remains controlled and distributed, while total host load remains high enough to justify separate capacity follow-up.
We ran two isolated experiments:
- Disable HTTP/3 (QUIC) on Caddy by removing UDP 443.
- Enable RPS/RFS to spread packet receive processing across all CPUs.
Results:
- Disabling HTTP/3 did not improve the one-core softirq hotspot.
- Enabling RPS/RFS reduced CPU2
%softfrom ~100% to ~48.51%. - The improvement persisted at T+1h and T+next-day checkpoints.
- Global host load remained high (
11.83 / 11.59 / 10.82), so we treated this as a distribution fix, not a full capacity fix.
Protocol boundary note: Clients can connect to the edge proxy via HTTP/3 while the proxy communicates with backend services over existing HTTP transport. Backend native HTTP/3 support is not required to offer HTTP/3 at the edge. Whether to enable or disable HTTP/3 at the proxy should be treated as a product/operations choice guided by monitoring, not as a default performance lever.
See torrust-tracker-demo#31 for the rationale on re-enabling edge HTTP/3, and torrust-tracker#1736 for tracking native HTTP/3 support in the tracker.
What Problem We Detected
The tracker host was under sustained CPU pressure. Standard process-level checks showed high utilization, but one pattern stood out: kernel networking work was concentrated on CPU2.
mpstatrepeatedly showed CPU2 pinned in%soft.ksoftirqd/2appeared near the top CPU consumers.- User-space load was real, but the single-core kernel hotspot was the main anomaly.
For context, softirq is kernel-side packet processing work. If this work is not
distributed well, one core can saturate even when the machine still has available cores.
Initial htop Snapshot (Before Patch)
This is the initial screenshot where CPU2 was pinned at 100% usage during the softirq hotspot.
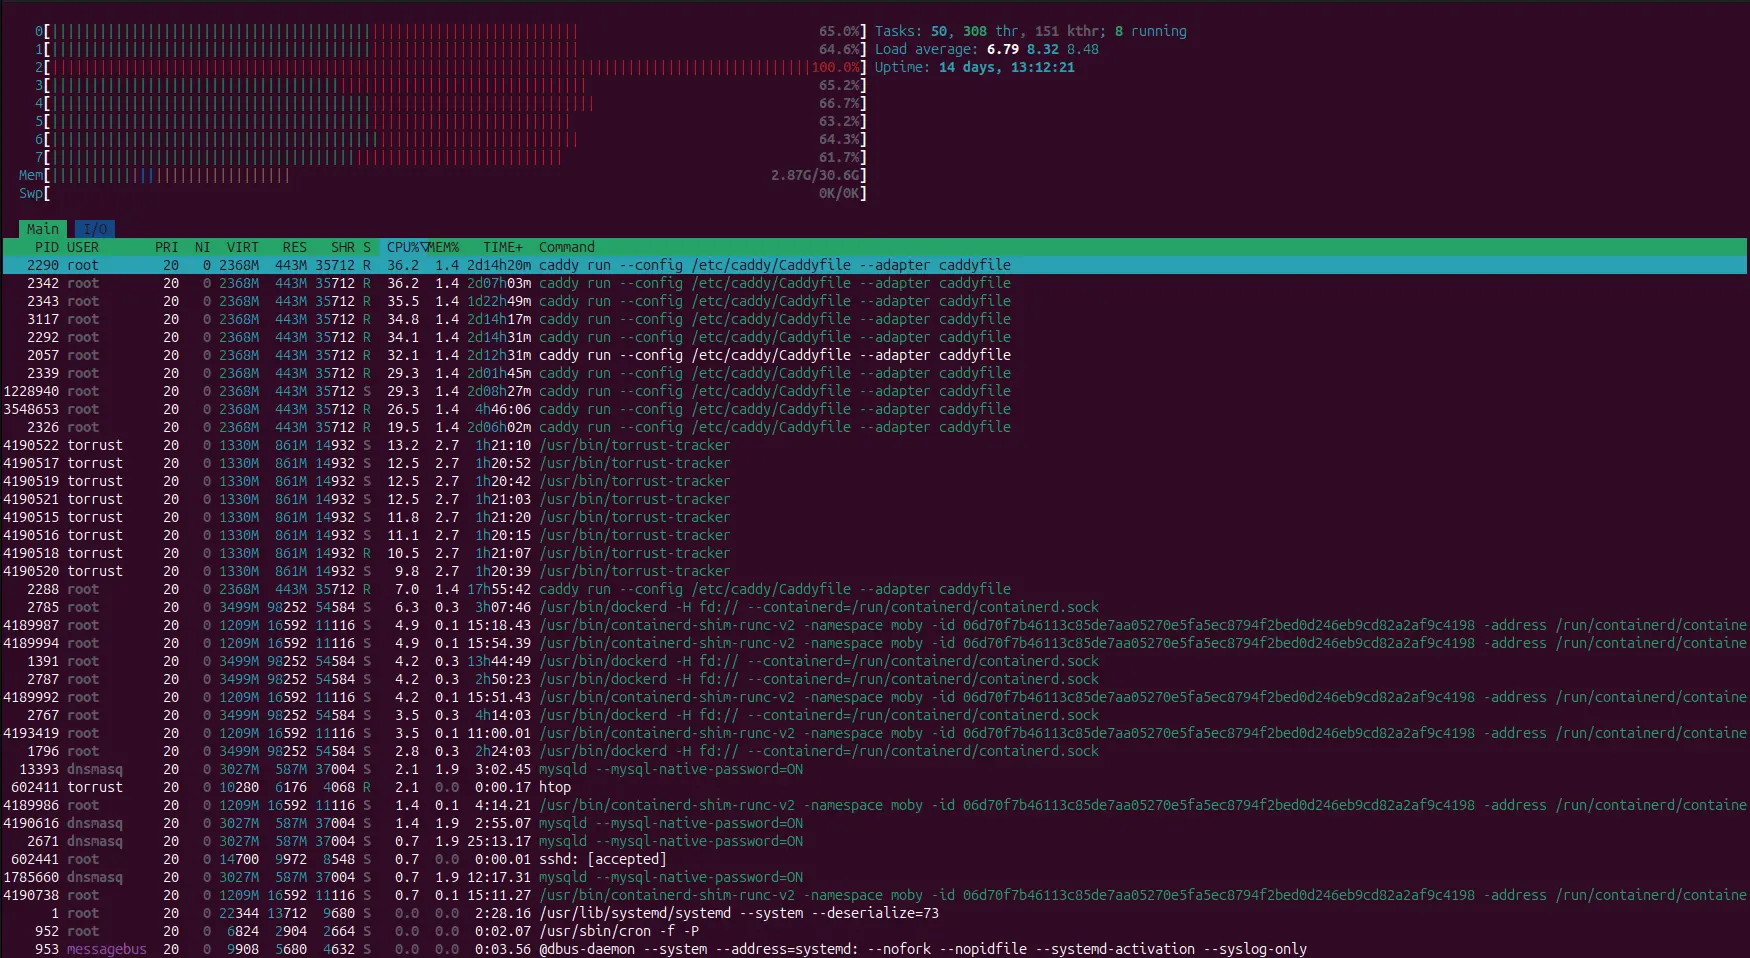
Before patch: CPU2 was saturated, indicating concentrated packet-processing load.
Method: One Variable at a Time
To avoid ambiguous conclusions, we changed one thing per phase and compared snapshots using the same metrics:
mpstat -P ALL 1 1for per-CPU softirq distribution.ps -eo pid,comm,%cpu,%mem,stat --sort=-%cpu | head -20for top CPU processes.docker stats --no-streamfor container-level CPU snapshots.- Prometheus HTTP/UDP request rates to keep traffic context comparable.
- External endpoint checks from
newtrackon.com/raw.
Phase 2: Disable HTTP/3 (QUIC)
Hypothesis: UDP 443 (HTTP/3) on Caddy might be adding packet-processing pressure. We removed only that UDP publish and restarted Caddy.
ports:
  - "80:80"
  - "443:443"
- - "443:443/udp"docker compose up -d caddySelected checkpoint after this phase:
T+next-day (2026-05-05T06:16:14Z)
CPU2 %soft=98.02, %idle=1.98
caddy=308.89%, tracker=93.22%
HTTP1 rate=1909.11 req/s, UDP1 rate=2178.98 req/s
HTTP1/UDP1 external status: Working
Conclusion: disabling HTTP/3 did not change the one-core softirq bottleneck. This experiment confirmed that QUIC packet processing on UDP 443 was not the driver of the hotspot. Enabling or disabling HTTP/3 at the edge proxy should be treated as a separate product/operations decision — see the follow-up rationale for re-enabling it.
Phase 3: Enable RPS/RFS
Next hypothesis: packet receive-side work was not being distributed across CPUs. Before the change, steering was effectively disabled.
net.core.rps_sock_flow_entries = 0
/sys/class/net/eth0/queues/rx-0/rps_cpus = 00
/sys/class/net/eth0/queues/rx-0/rps_flow_cnt = 0
We applied the live test change:
sudo sysctl -w net.core.rps_sock_flow_entries=32768
echo ff | sudo tee /sys/class/net/eth0/queues/rx-0/rps_cpus
echo 4096 | sudo tee /sys/class/net/eth0/queues/rx-0/rps_flow_cnt
Immediate post-change snapshot:
Post-change (2026-05-05T06:55:40Z)
all CPUs: %soft=30.15
CPU2: %soft=48.51, %idle=9.90
other CPUs: %soft distributed across ~24-33%

caddy=411.88%, tracker=123.77%, mysql=9.67%
pre  HTTP=1912.99 req/s, UDP=2234.14 req/s
post HTTP=1926.15 req/s, UDP=2207.48 req/s
HTTP1/UDP1 external status: Working
At T+1h and T+next-day, CPU2 remained around 49.48-49.49% softirq and load stayed
distributed. This confirms RPS/RFS removed the one-core packet hotspot.
htop Snapshot After Patch
After enabling RPS/RFS, load was distributed across CPUs instead of being concentrated on CPU2.
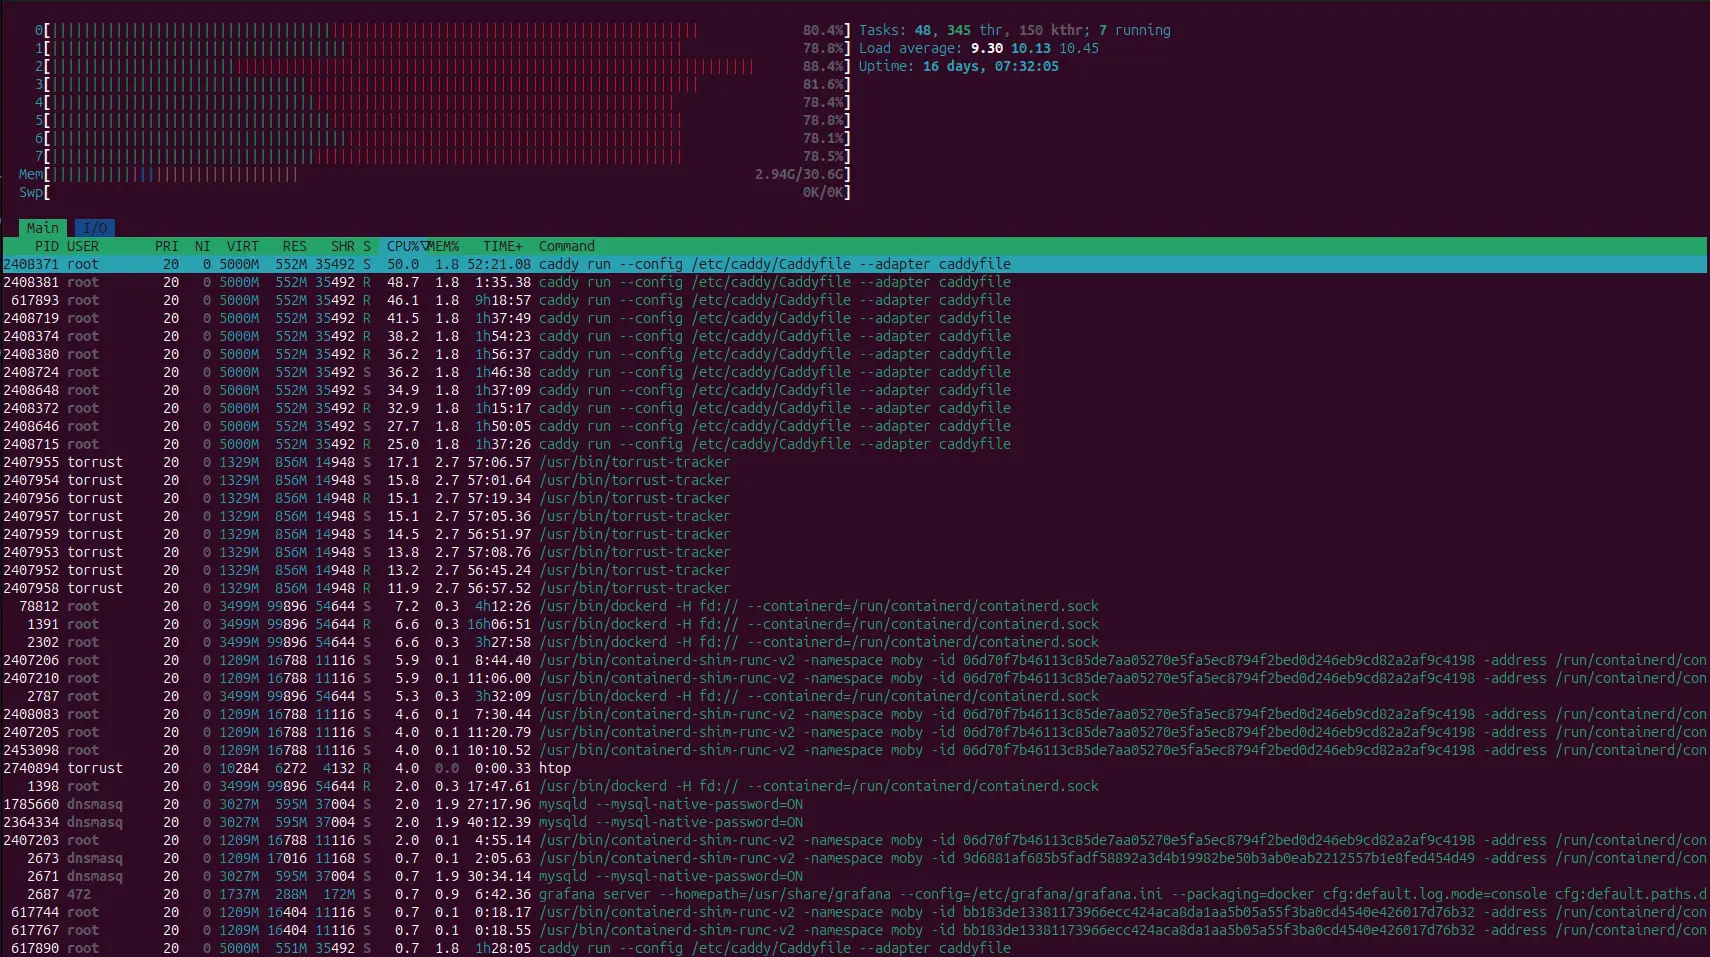
After patch: packet-processing pressure is spread across cores.
Why This Did Not Fully Solve Host Load
RPS/RFS solved distribution, not demand. The host still ran with high global load averages after the fix. In other words, the previous failure mode (single-core saturation) was mitigated, but total workload pressure remained near capacity.
Even with high server load, observed tracker availability on NewTrackon stayed above 99%. This is an important distinction: high load reduced headroom, but service quality remained strong during the observation window.
udp://udp1.torrust-tracker-demo.com:6969/announce: latency21 mshttps://http1.torrust-tracker-demo.com:443/announce: latency29 ms
At peak, we are handling about 1200 UDP req/s and a little over 2200 HTTP req/s.
Traffic Over the Last 15 Days
This Grafana Generic Tracker Dashboard screenshot shows announce requests per second over the last 15 days for both UDP1 and HTTP1 trackers.
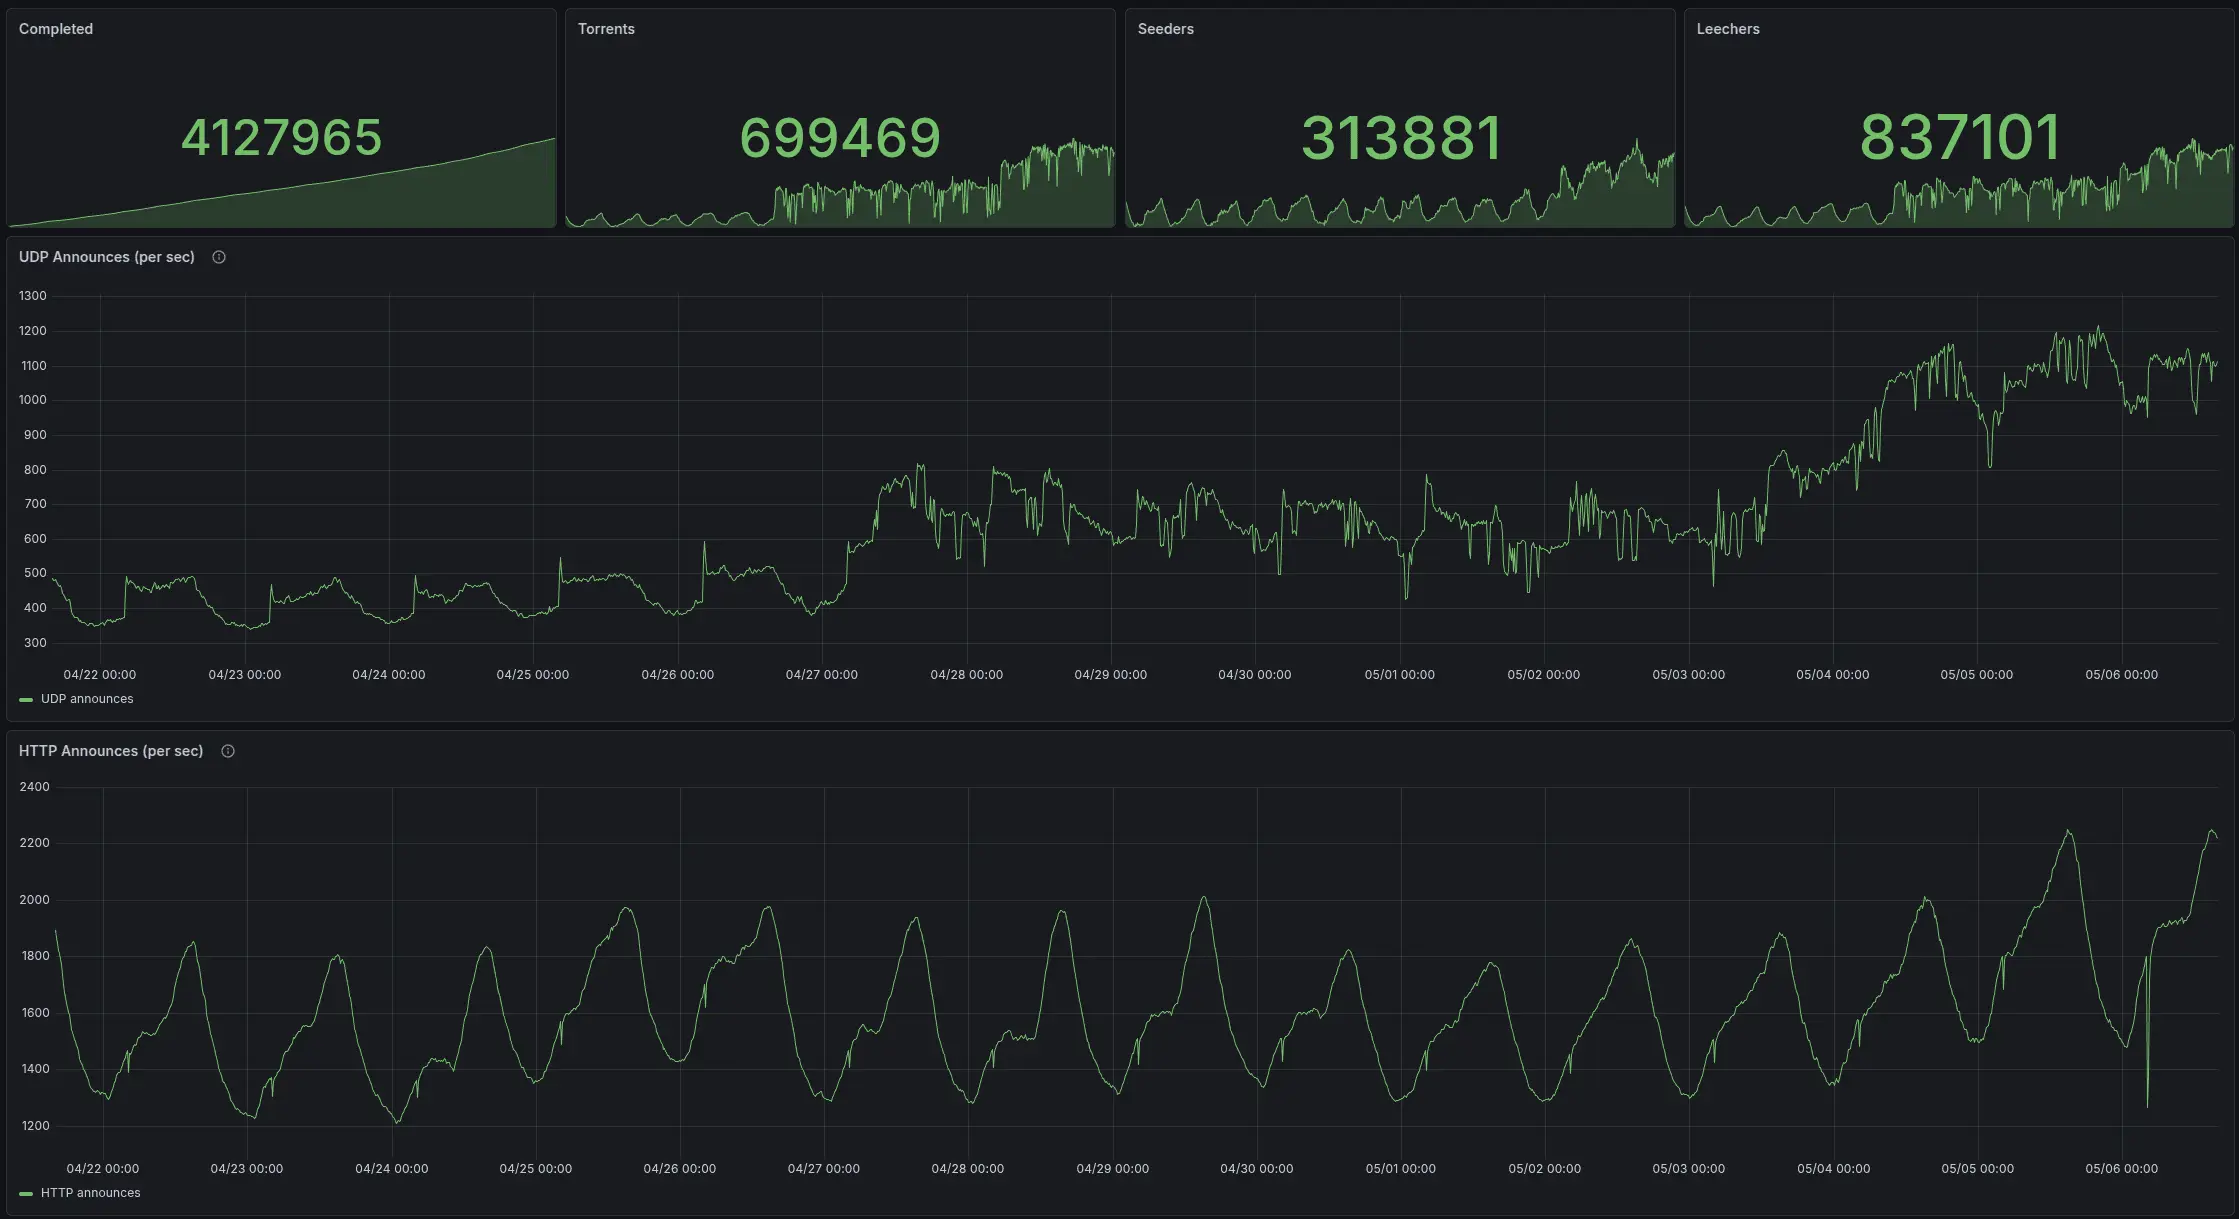
Last 15 days: announce request rate trends for udp1.torrust-tracker-demo.com and http1.torrust-tracker-demo.com.
Timeline Checkpoints
- Before changes: CPU2 repeatedly near
100% softirq. - After HTTP/3 disable: no meaningful improvement in CPU2 softirq.
- Immediate after RPS/RFS: CPU2 softirq dropped to
48.51%. - T+1h: distribution remained stable, CPU2 around
49.48%. - T+next-day: distribution persisted, CPU2 around
49.49%.
Final Operational Decision
- Keep RPS/RFS enabled permanently on the current host.
- Close the tuning scope in ISSUE-29 as completed.
- Track capacity follow-up separately (scale-up planning in ISSUE-30).
- HTTP/3 at the edge proxy is a separate product/operations decision. See torrust-tracker-demo#31 for the rationale on re-enabling it, and torrust-tracker#1736 for tracking native HTTP/3 support.
The practical outcome is clear: packet-path tuning fixed the single-core bottleneck, and capacity planning becomes the next lever for sustained growth.