The New Torrust Tracker Demo Is Live
We have launched a dedicated Torrust Tracker Demo on Hetzner, featuring HTTP and UDP trackers, MySQL storage, IPv6 support, and full observability via Prometheus and Grafana — and we are sharing every detail publicly.

Hello, Torrust community!
We are excited to announce that the new Torrust Tracker Demo is live and publicly accessible. You can connect to it right now:
- HTTP tracker:
https://http1.torrust-tracker-demo.com:443/announce - UDP tracker:
udp://udp1.torrust-tracker-demo.com:6969/announce
Everything is open and documented. If there is something you cannot find, ask us and we will publish it — we want this to be genuinely useful for anyone who wants to set up their own tracker.
Background: The Combined Torrust Demo
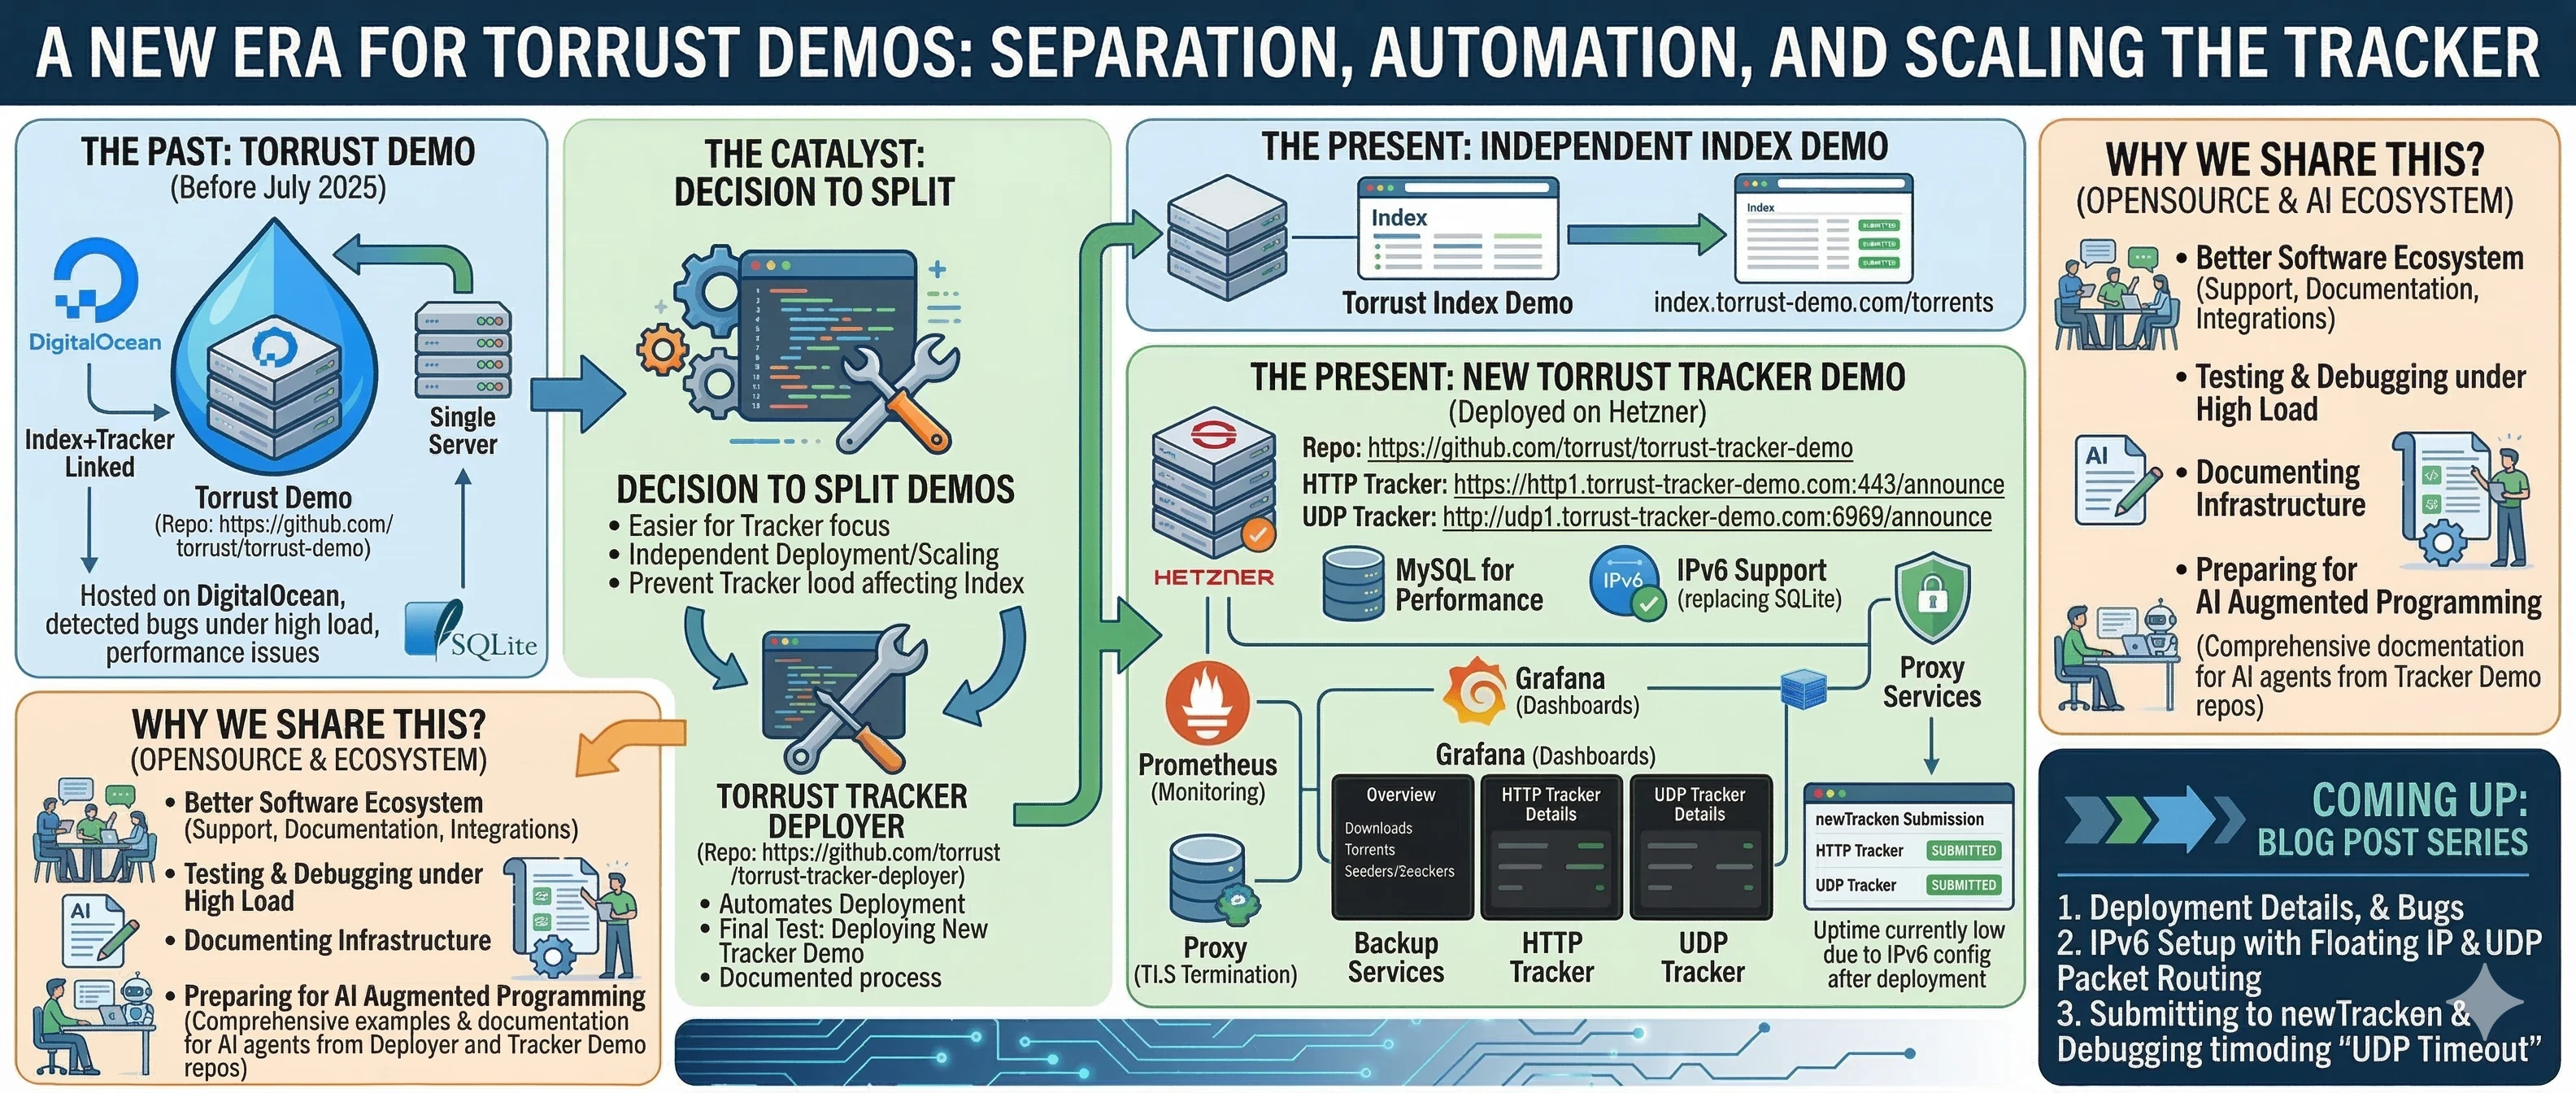
For the past couple of years we have been running the Torrust Demo, a combined Tracker + Index solution hosted on a Digital Ocean droplet. The demo index was available at index.torrust-demo.com/torrents, and the tracker it used was linked to it so that every uploaded torrent automatically included the demo tracker URL.
That combined demo has been invaluable. Running under sustained real-world load exposed bugs that were simply impossible to catch in a local development environment or with synthetic benchmarks. We fixed many issues that would otherwise have slipped through to final releases.
Why We Split the Demo
In July 2025, we decided to separate the combined demo into two independent projects — one focused purely on the Tracker, and one focused on the Index. The main reasons were:
- Cleaner onboarding: people only interested in the tracker no longer need to wade through index-specific setup and documentation.
- Independent lifecycle: we can deploy, update, migrate, and scale each demo on its own schedule without any coupling. We could already update individual services via Docker Compose, but full separation gives us much more freedom — for example, to move the tracker to a beefier machine if load demands it.
- Load isolation: tracker traffic no longer affects index demo performance, and vice versa.
- Cleaner tracker-only example: once we wanted a pure tracker showcase, keeping the tracker inside the same repo as the index example would have created confusion.
Building the Deployer First
When we started the migration in September 2025, we made a deliberate choice: instead of simply spinning up a new server and copying the application over (a few hours of work), we would first build a tool that automates the entire deployment. That is what became the Torrust Tracker Deployer.
Deploying the new Torrust Tracker Demo was the final end-to-end test for the deployer. We ran through the full deployment using the tool and recorded every detail:
The deployer is nearly complete, but we have not published an official release yet — the tracker demo was the production shake-out. A dedicated blog post about the deployment process, including every bug we hit, every decision we made, and how we resolved each issue, is coming soon.
The New Demo Setup
The new demo runs on Hetzner, a German cloud provider. The repository for the demo is github.com/torrust/torrust-tracker-demo, and all server configuration details are shared there publicly.
Key Differences from the Previous Demo
The previous demo tracker (udp://tracker.torrust-demo.com:6969/announce) used
SQLite as its database backend. That was a deliberate choice when we set it up — we wanted
to keep things simple. After running it for over two years, we wanted to try something
different with the new standalone demo:
- MySQL instead of SQLite: we switched to MySQL to test tracker performance and stability with a relational database under production load. The SQLite demo taught us a lot; now we want the same insight for MySQL.
- IPv6 support: the previous demo was IPv4-only. The new demo includes IPv6 from the start, which required custom routing configuration on the server — more on that in an upcoming dedicated post.
Observability: Prometheus and Grafana
The tracker is instrumented with Prometheus and we have set up three Grafana dashboards to monitor it in real time:
- Overview dashboard: completed downloads, number of torrents, seeders, leechers, UDP announce requests/s, and HTTP announce requests/s.
- UDP tracker dashboard: connections/s, announces/s, scrapes/s, errors/s, average connect/announce/scrape times, banned requests/s, requests and responses/s, banned IPs, and aborted requests/s.
- HTTP tracker dashboard: announces/s and scrapes/s.
You can see a practical walkthrough of this exact kind of setup in our earlier post, Visualize Tracker Metrics with Prometheus and Grafana.
Submitted to Newtrackon
Both trackers have been submitted to newtrackon.com, a public tracker monitoring service that continuously checks tracker availability and measures uptime.
A Note on UDP Tracker Uptime
Why We Share All of This
We believe that a healthy software ecosystem is built on more than just good tools. It also requires:
- Responsive support — quick bug fixes and clear communication
- Thorough documentation — not just API docs, but real operational guides
- Integration with the broader ecosystem — connecting to the services people already use
Running our own demo lets us do all three by "eating our own cooking". Specifically, it allows us to:
- Test the tracker under real, sustained load in a production environment
- Catch bugs before they reach official releases
- Experience the pain of our own software first-hand and use that to drive improvements
- Publish documented infrastructure — which is, frankly, still rare in the open-source world
An Extra Reason: Building for AI Agents
As AI-augmented programming becomes mainstream, it is increasingly important to provide concrete, comprehensive examples that agents can reason about. Both the Torrust Tracker Deployer and the Torrust Tracker Demo repositories contain detailed, well-structured documentation about how to set up the Torrust Tracker in a real production environment, integrated with:
- Prometheus for metrics collection
- Grafana for dashboards and alerting
- Backup services for data durability
- A reverse proxy for TLS termination
Whether you are a human engineer or an AI agent reading this documentation, our goal is the same: give you everything you need to go from zero to a running, monitored, production tracker. We also wrote more about this philosophy in our post Building with AI Agents, Building for AI Agents.
What's Next
This post is the first in a short series. The following articles are planned:
- Deployment deep-dive: a detailed look at the full deployment of the demo — every decision, every problem we hit, and how we resolved it.
- IPv6 with a floating IP: how to correctly configure IPv6 on a Hetzner server with a floating IP, including the asymmetric routing problem that affects UDP trackers and how to solve it.
- Submitting a tracker to Newtrackon: what Newtrackon requires from a tracker, tips for debugging "UDP Timeout" and similar errors, and how to verify your tracker is answering correctly before submitting.
Stay tuned, and as always — if you have questions, open an issue in the relevant repository or reach out to the community. We read everything.
Summary