Table of Contents
Introduction
In the ever-evolving landscape of BitTorrent technology, performance and scalability are paramount. Torrust stands at the forefront, offering a suite of open-source software products designed to enhance peer-to-peer file sharing. At the heart of this suite is the Torrust BitTorrent Tracker, a Rust-based engine crafted for efficiency and speed. This post will introduce you to the benchmarking tools we are using at the moment for the tracker. It will also shed light on its performance and how it stacks up against its contemporaries.
Before going into details we should explain what are the tradeoffs we did on the design of the Torrust Tracker. Our goal is to design a robust, reliable and fast tracker but at the same time a feature-reach and sustainable one. Very often those two groups of objectives are exclusive. We know that being the fastest tracker implies some drawbacks. In general, our rule is:
“Embracing a slight slowdown for substantial benefits underlines our commitment to delivering a tracker that’s not just fast but also rich in features and usability.”
We decided to use Rust due to its speed and memory-safe features but we also wanted to build a tracker with the following features:
- A comprehensive API that allow users to perform any action or extract any data from the tracker.
- A good support for observability. For example, a logging system that allow users to detect errors or extract statistics. The logging has several levels. Enabling more verbose logging affects performance. But if you are only interested in performance you can disable logging. Observability it’s also related to testing. Code without support for observability it’s usually hard to test too.
- A sustainable code. Very often “fast code” means “direct code” without abstraction layers and separation of concerns, but that leads to code that is hard to maintain and eventually to a death project. It’s hard to attract maintainers for open-source projects that are hard to understand. And even if it’s not hard to understand it’s usually hard to change because there are no independent parts that can be changed independently.
Understating The Tracker
BitTorrent trackers play a crucial role in the file-sharing ecosystem, acting as intermediaries that facilitate the transfer of files among users. By tracking peer locations and helping them connect, these trackers ensure the swift and reliable distribution of data.
Before benchmarking the tracker is important to know the internal architecture of the tracker. A deep dive into the Torrust Tracker’s architecture reveals a four-layer design, crucial for benchmarking accuracy.
The first layer is the delivery layer. Clients can connect to the tracker in different ways: using the HTTP tracker, the UDP tracker, the tracker API or console commands. Internally all requests are routed through application services and reaching the main tracker domain service that handles the announce and scrape requests. At the lowest level the tracker service stores all the information in different data structures. One of them is the torrent repository that holds the list of torrents. Each torrent entry on the list contains statistics like how many peers have downloaded the torrent and the list of peers for that torrent (swarm).
Benchmarking Methodology
Our benchmarking approach encompasses three pivotal areas:
- Internal repository benchmarking: Evaluating the repository within the tracker responsible for managing peer lists across torrents.
- End-to-End benchmarking: Utilizing an external UDP tracker load test tool from the aquatic repository to simulate some real-world scenarios.
- Comparative Benchmarking with other trackers: Employing the “Bencher” from the Aquatic GitHub repository to compare the Torrust Tracker against notable implementations like opentracker, Chihaya, and aquatic itself.
Internal Repository Benchmarking
Basically a tracker is just a shared data structure between all the BitTorrent peers. Peers announce themselves and the tracker builds up a list of torrents. For each torrent, the tracker keeps a list of peers interested in that torrent. The in-memory data structure is an array of structures that look like this one (example in JSON):
{
	"info_hash": "090c6d4fb3a03191c4ef1fda6236ef0efb2d5c10",
	"seeders": 1,
	"completed": 1,
	"leechers": 0,
	"peers": [
		{
			"peer_id": {
				"id": "0x2d71423030303030303030303030303030303031",
				"client": null
			},
			"peer_addr": "0.0.0.0:17548",
			"updated": 1709916034742,
			"updated_milliseconds_ago": 1709916034742,
			"uploaded": 0,
			"downloaded": 0,
			"left": 0,
			"event": "Completed"
		}
	]
}
There are many ways to keep this information in memory. The access to this data is actually a bottleneck. Eventually all requests hit this structure. The problem is all announce requests need to update this structure. Due to Rust owning rules, only the owner can write into this struct. We have been trying different implementations to minimize contention. There is a trait for the torrent “Repository”. You can benchmark the different repository implementations by running the following command:
cargo run --release -p torrust-torrent-repository-benchmarks -- --threads 4 --sleep 0 --compare trueThe output at the time of writing this post is:
tokio::sync::RwLock<std::collections::BTreeMap<InfoHash, Entry>>
add_one_torrent: Avg/AdjAvg: (60ns, 59ns)
update_one_torrent_in_parallel: Avg/AdjAvg: (10.909457ms, 0ns)
add_multiple_torrents_in_parallel: Avg/AdjAvg: (13.88879ms, 0ns)
update_multiple_torrents_in_parallel: Avg/AdjAvg: (7.772484ms, 7.782535ms)

std::sync::RwLock<std::collections::BTreeMap<InfoHash, Entry>>
add_one_torrent: Avg/AdjAvg: (43ns, 39ns)
update_one_torrent_in_parallel: Avg/AdjAvg: (4.020937ms, 4.020937ms)
add_multiple_torrents_in_parallel: Avg/AdjAvg: (5.896177ms, 5.768448ms)
update_multiple_torrents_in_parallel: Avg/AdjAvg: (3.883823ms, 3.883823ms)

std::sync::RwLock<std::collections::BTreeMap<InfoHash, Arc<std::sync::Mutex<Entry>>>>
add_one_torrent: Avg/AdjAvg: (51ns, 49ns)
update_one_torrent_in_parallel: Avg/AdjAvg: (3.252314ms, 3.149109ms)
add_multiple_torrents_in_parallel: Avg/AdjAvg: (8.411094ms, 8.411094ms)
update_multiple_torrents_in_parallel: Avg/AdjAvg: (4.106086ms, 4.106086ms)

tokio::sync::RwLock<std::collections::BTreeMap<InfoHash, Arc<std::sync::Mutex<Entry>>>>
add_one_torrent: Avg/AdjAvg: (91ns, 90ns)
update_one_torrent_in_parallel: Avg/AdjAvg: (3.542378ms, 3.435695ms)
add_multiple_torrents_in_parallel: Avg/AdjAvg: (15.651172ms, 15.651172ms)
update_multiple_torrents_in_parallel: Avg/AdjAvg: (4.368189ms, 4.257572ms)

tokio::sync::RwLock<std::collections::BTreeMap<InfoHash, Arc<tokio::sync::Mutex<Entry>>>>
add_one_torrent: Avg/AdjAvg: (111ns, 109ns)
update_one_torrent_in_parallel: Avg/AdjAvg: (6.590677ms, 6.808535ms)
add_multiple_torrents_in_parallel: Avg/AdjAvg: (16.572217ms, 16.30488ms)
update_multiple_torrents_in_parallel: Avg/AdjAvg: (4.073221ms, 4.000122ms)
We are benchmarking four scenarios that we think are the most relevant:
- Adding one torrent: How long it takes to add a new torrent to the tracker when there is only one peer. We run it several times sequentially to calculate the average.
- Update one torrent in parallel: This is the same as the previous one but running updates in parallel, meaning we spawn some threads to make the same request. This case tries to simulate the case where multiple peers try to announce the same torrent, so they are competing to write on the same repository entry, which contains the peer list.
- Add multiple torrents in parallel: In this case, the same peer is adding different torrents at the same time. This case tries to simulate many peers announcing different torrents, so they are not conflicting to access the same peer list.
- Update multiple torrents in parallel: Finally, this case is the same as the previous one, but we prefill the repository with all the torrents. This tries to simulate an scenario where multiple peers are announcing multiple torrents but the torrent entries already exists. The main different in this case is that the application might not need to allocate more memory to increase the data structure. So the problem is reduced to contention or locking (how many writes we can do in parallel on the same peer list).
At the moment we are trying with other data structures that allow concurrent updates like DashMap. See https://github.com/torrust/torrust-tracker/issues/565.
E2E UDP Benchmarking
We have been using one of the aquatic packages to test the UDP tracker performance as a whole service.
Aquatic is a high-performance open BitTorrent tracker including a lot a packages. One of the tools provided by Aquatic is a UDP load test command.
In order to test the Torrust Tracker with the “UDP load test” tool you need to run both the tracker and this tester.
Running the Torrust Tracker
You can follow the Torrust Tracker documentation to install the tracker but there is an especial configuration for benchmarking. First at all, you should build the tracker for release (--release) and you should also disable all services. Finally you should set the logging level to error.
Logging levels are: Off, Error, Warn, Info, Debug and Trace. The more you increase the log level and the verbosity the worse the performance results are.
We provide a especial configuration for benchmarking ./share/default/config/tracker.udp.benchmarking.toml with the best configuration to test the performance of the UDP tracker. After cloning the tracker repo you can build and run it with:
cargo build --release
TORRUST_TRACKER_PATH_CONFIG="./share/default/config/tracker.udp.benchmarking.toml" ./target/release/torrust-trackerRunning The Aquatic UDP Load Test
For updated instructions about how to setup the tool please follow the official documentation.
cd /tmp
git clone git@github.com:greatest-ape/aquatic.git
cd aquatic
cargo build --release -p aquatic_udp_load_test
./target/release/aquatic_udp_load_test -p > "load-test-config.toml"
The last line ./target/release/aquatic_udp_load_test -p > "load-test-config.toml" generates a config file. At least you will need to change the UDP port from 3000 to 6969 which is the default one in the Torrust Tracker. You can also edit other options like how many requests of each type you want to make.
Edit the load-test-config.toml:
# ...
server_address = "127.0.0.1:6969"
# ...
# Probability that a generated request is a connect request as part
# of sum of the various weight arguments.
weight_connect = 50
# Probability that a generated request is a announce request, as part
# of sum of the various weight arguments.
weight_announce = 50
# Probability that a generated request is a scrape request, as part
# of sum of the various weight arguments.
weight_scrape = 1
# ...
Finally you can run the test with:
./target/release/aquatic_udp_load_test -c "load-test-config.toml"Test Results
Just as an example we show the test results with a non dedicated machine.
Machine used for the test:
- RAM: 64GiB
- Processor: AMD Ryzen 9 7950X x 32
- Graphics: AMD Radeon Graphics / Intel Arc A770 Graphics (DG2)
- OS: Ubuntu 23.04
- OS Type: 64-bit
- Kernel Version: Linux 6.2.0-20-generic
Test result:
Requests out: 388702.94/second
Responses in: 349832.25/second
  - Connect responses:  173325.85
  - Announce responses: 173061.13
  - Scrape responses:   3445.27
  - Error responses:    0.00
Peers per announce response: 0.00
Announce responses per info hash:
  - p10: 1
  - p25: 1
  - p50: 1
  - p75: 1
  - p90: 2
  - p95: 3
  - p99: 106
  - p99.9: 283
- p100: 357Comparative UDP Benchmarking With Other Trackers
Aquatic also provides a tool to compare how several trackers perform on the same machine. At the moment they support these tracker:
We’ve opened a PR to add support to the Torrust Tracker too.
In order to run the Bencher you need to install all the trackers first.
Setup The Chihaya Tracker
Follow the official documentation. You will need to install Go:
sudo apt install golang-goSetup The Opentracker Tracker
You can make it from sources following the official documentation or install it on Ubuntu with:
cd /tmp
cvs -d :pserver:cvs@cvs.fefe.de:/cvs -z9 co libowfat
cd libowfat
make
cd ..
git clone git://erdgeist.org/opentracker
cd opentracker
make
cp opentracker ~/bin
opentracker -h
NOTICE: Installing the opentracker from Ubuntu repositories did not work for us. Maybe arguments to run the application have changes in recent versions.
Setup The Aquatic Tracker
You can follow the official documentation. At the moment this is the process:
sudo apt update && sudo apt upgrade -y
sudo apt-get install libhwloc-dev
cd /tmp
git clone git@github.com:greatest-ape/aquatic.git
cd aquatic
cargo build --profile=release-debug --all-features -p aquatic_udp
NOTICE: libhwloc-dev is needed for io-uring feature.
Running The Bencher
You don’t need to run the trackers manually the Bencher does it. First you need to build the Bencher:
cd /tmp
git clone git@github.com:greatest-ape/aquatic.git
cd aquatic
cargo build --profile=release-debug -p aquatic_bencher
And then you can run it with:
./target/release-debug/aquatic_bencher udpIf you also want to include the Torrust Tracker make sure you use the fork in the PR.
Bencher Results
Again, this is only an example with the test result using a non dedicated machine.
Machine used for the test:
- RAM: 64GiB
- Processor: AMD Ryzen 9 7950X x 32
- Graphics: AMD Radeon Graphics / Intel Arc A770 Graphics (DG2)
- OS: Ubuntu 23.04
- OS Type: 64-bit
- Kernel Version: Linux 6.2.0-20-generic
Bencher result:
# Benchmark report

Total number of load test runs: 72
Estimated duration: 0 hours, 44 minutes

## Tracker cores: 1 (cpus: 0,16)
### aquatic_udp run (socket workers: 1) (load test workers: 8, cpus: 8-15,24-31)
- Average responses per second: 351,834
- Average tracker CPU utilization: 95.5%
- Peak tracker RSS: 192.5 MiB
### aquatic_udp run (socket workers: 1) (load test workers: 12, cpus: 4-15,20-31)
- Average responses per second: 372,991
- Average tracker CPU utilization: 95.5%
- Peak tracker RSS: 191.9 MiB
### aquatic_udp (io_uring) run (socket workers: 1) (load test workers: 8, cpus: 8-15,24-31)
- Average responses per second: 389,576
- Average tracker CPU utilization: 95.5%
- Peak tracker RSS: 214 MiB
### aquatic_udp (io_uring) run (socket workers: 1) (load test workers: 12, cpus: 4-15,20-31)
- Average responses per second: 409,824
- Average tracker CPU utilization: 95.5%
- Peak tracker RSS: 214.7 MiB
### opentracker run (workers: 0) (load test workers: 8, cpus: 8-15,24-31)
- Average responses per second: 297,698
- Average tracker CPU utilization: 95.5%
- Peak tracker RSS: 71.7 MiB
### opentracker run (workers: 0) (load test workers: 12, cpus: 4-15,20-31)
- Average responses per second: 307,874
- Average tracker CPU utilization: 95.5%
- Peak tracker RSS: 72 MiB
### opentracker run (workers: 1) (load test workers: 8, cpus: 8-15,24-31)
- Average responses per second: 343,570
- Average tracker CPU utilization: 95.4%
- Peak tracker RSS: 72 MiB
### opentracker run (workers: 1) (load test workers: 12, cpus: 4-15,20-31)
- Average responses per second: 378,880
- Average tracker CPU utilization: 95.3%
- Peak tracker RSS: 72.2 MiB
### chihaya run () (load test workers: 8, cpus: 8-15,24-31)
- Average responses per second: 115,159
- Average tracker CPU utilization: 190%
- Peak tracker RSS: 863.4 MiB
### chihaya run () (load test workers: 12, cpus: 4-15,20-31)
- Average responses per second: 113,002
- Average tracker CPU utilization: 190%
- Peak tracker RSS: 867.4 MiB
### torrust-tracker run () (load test workers: 8, cpus: 8-15,24-31)
- Average responses per second: 222,330
- Average tracker CPU utilization: 189%
- Peak tracker RSS: 193.3 MiB
### torrust-tracker run () (load test workers: 12, cpus: 4-15,20-31)
- Average responses per second: 216,407
- Average tracker CPU utilization: 189%
- Peak tracker RSS: 191.8 MiB
## Tracker cores: 2 (cpus: 0-1,16-17)
### aquatic_udp run (socket workers: 2) (load test workers: 8, cpus: 8-15,24-31)
- Average responses per second: 699,783
- Average tracker CPU utilization: 191%
- Peak tracker RSS: 195.6 MiB
### aquatic_udp run (socket workers: 2) (load test workers: 12, cpus: 4-15,20-31)
- Average responses per second: 804,774
- Average tracker CPU utilization: 191%
- Peak tracker RSS: 193.9 MiB
### aquatic_udp (io_uring) run (socket workers: 2) (load test workers: 8, cpus: 8-15,24-31)
- Average responses per second: 749,745
- Average tracker CPU utilization: 190%
- Peak tracker RSS: 237.4 MiB
### aquatic_udp (io_uring) run (socket workers: 2) (load test workers: 12, cpus: 4-15,20-31)
- Average responses per second: 797,605
- Average tracker CPU utilization: 190%
- Peak tracker RSS: 239 MiB
### opentracker run (workers: 2) (load test workers: 8, cpus: 8-15,24-31)
- Average responses per second: 692,167
- Average tracker CPU utilization: 190%
- Peak tracker RSS: 71.5 MiB
### opentracker run (workers: 2) (load test workers: 12, cpus: 4-15,20-31)
- Average responses per second: 780,108
- Average tracker CPU utilization: 190%
- Peak tracker RSS: 72 MiB
### chihaya run () (load test workers: 8, cpus: 8-15,24-31)
- Average responses per second: 185,137
- Average tracker CPU utilization: 371%
- Peak tracker RSS: 8.2 GiB
### chihaya run () (load test workers: 12, cpus: 4-15,20-31)
- Average responses per second: 186,243
- Average tracker CPU utilization: 380%
- Peak tracker RSS: 7.1 GiB
### torrust-tracker run () (load test workers: 8, cpus: 8-15,24-31)
- Average responses per second: 415,864
- Average tracker CPU utilization: 374%
- Peak tracker RSS: 188.4 MiB
### torrust-tracker run () (load test workers: 12, cpus: 4-15,20-31)
- Average responses per second: 407,551
- Average tracker CPU utilization: 375%
- Peak tracker RSS: 188.9 MiB
## Tracker cores: 4 (cpus: 0-3,16-19)
### aquatic_udp run (socket workers: 4) (load test workers: 8, cpus: 8-15,24-31)
- Average responses per second: 1,270,832
- Average tracker CPU utilization: 369%
- Peak tracker RSS: 194.9 MiB
### aquatic_udp run (socket workers: 4) (load test workers: 12, cpus: 4-15,20-31)
- Average responses per second: 1,482,250
- Average tracker CPU utilization: 382%
- Peak tracker RSS: 194.9 MiB
### aquatic_udp (io_uring) run (socket workers: 4) (load test workers: 8, cpus: 8-15,24-31)
- Average responses per second: 1,217,457
- Average tracker CPU utilization: 354%
- Peak tracker RSS: 237.9 MiB
### aquatic_udp (io_uring) run (socket workers: 4) (load test workers: 12, cpus: 4-15,20-31)
- Average responses per second: 1,618,228
- Average tracker CPU utilization: 381%
- Peak tracker RSS: 284.3 MiB
### opentracker run (workers: 4) (load test workers: 8, cpus: 8-15,24-31)
- Average responses per second: 1,348,825
- Average tracker CPU utilization: 381%
- Peak tracker RSS: 71.5 MiB
### opentracker run (workers: 4) (load test workers: 12, cpus: 4-15,20-31)
- Average responses per second: 1,546,907
- Average tracker CPU utilization: 381%
- Peak tracker RSS: 71 MiB
### chihaya run () (load test workers: 8, cpus: 8-15,24-31)
...IMPORTANT: The test was run is a non dedicated machine running other tasks. It’s just an example. You can get the latest results with dedicated machine on the Aquatic repo.
The extracted and ordered results for 1 core are:
Average responses per second with 8 load test workers and cpus: 8-15,24-31
- 389,576 aquatic (io_uring)
- 351,834 aquatic
- 343,570 opentracker (workers 1)
- 297,698 opentracker (workers 0)
- 222,330 torrust-tracker
- 115,159 chihaya
Average responses per second with 12 load test workers and cpus: 4-15,20-31
- 409,824 aquatic (io_uring)
- 378,880 opentracker (workers 1)
- 372,991 aquatic
- 307,874 opentracker (workers 0)
- 216,407 torrust-tracker
- 113,002 chihaya
The latest official results (2024-02-10):
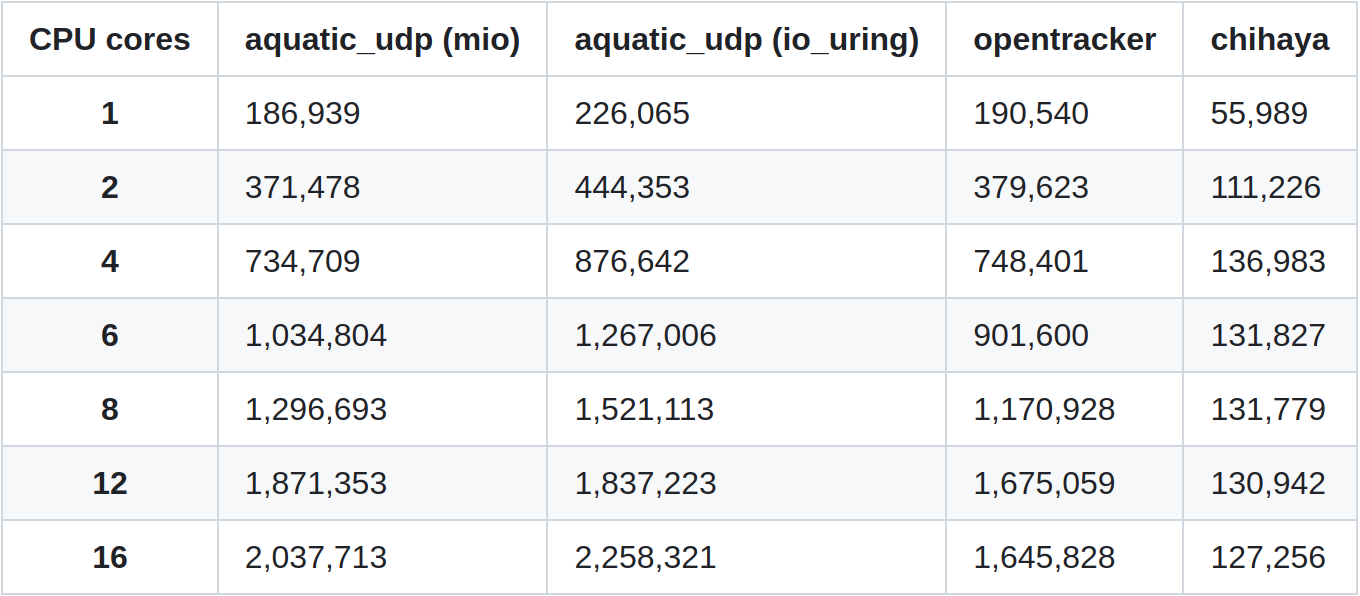
The Aquatic “Bencher” uses the Aquatic “UDP load test”.
Conclusion
As you have seen we are collecting metrics to improve the tracker and avoid performance regressions, by using these benchmarking tools provided by Aquatic. Although performance is important there are other factor like horizontal scalability that are even more critical because sooner or later no matter how powerful is your machine it will be not enough the handle all the requests. But that is our of the scope of this article.
On the other hand, we have analyzed performance only from the point of view of number of request handled per second. Memory consumption should be also considered. We have started instrumenting the application to track memory consumption. See https://github.com/torrust/torrust-tracker/issues/567.
If you see something wrong or you want to contribute by:
- Adding new sections.
- Fixing typos.
- Making it clearer.
- Adding links.
- Or whatever you think that could be interesting to have,
If you have any questions or issues please open an issue in the corresponding repository:
- Torrust Tracker: https://github.com/torrust/torrust-tracker/issues
- Torrust Index: https://github.com/torrust/torrust-index/issues
- Torrust Website: https://github.com/torrust/torrust-index-gui/issues
- Torrust Compose: https://github.com/torrust/torrust-compose
- Containerizing Rust Applications Examples: https://github.com/torrust/containerizing-rust-apps-examples
We very welcome any contributions to the projects or this article.
Links
Other trackers:
Crates for concurrent writes:
Other links: