Introduction
In our quest to elevate the Torrust BitTorrent Tracker’s performance, we’ve embraced a suite of sophisticated benchmarking and profiling tools. This article builds on our previous discussion, ”Benchmarking the Torrust BitTorrent Tracker” and delves into the metrics that guide our optimization efforts. Join us as we explore the intricacies of profiling in the dynamic landscape of BitTorrent technology.
In the previous article we introduced to the community the benchmarking tools we are using at the moment to know whether the Tracker performs at the same level as other applications on the market.
With those benchmarking tools we ensure that the Tracker has a good performance and we don’t have regressions. If you are curious about how we do benchmarking you can read the ”Benchmarking the Torrust BitTorrent Tracker” article.
In this article we will explain how we are collecting metrics to know which parts of the code we should improve.
Understanding The Tracker
Before you continue reading this article you should know a little bit about the tracker internal structure. You can see an overview on the ”Benchmarking the Torrust BitTorrent Tracker” article.
Current Challenges
Balancing feature-rich functionality with performance is our central challenge. The Torrents Repository, a critical component, has been our focus, serving as the primary bottleneck for scaling request handling capabilities.
Regardless which protocol clients use to connect to the tracker, eventually all requests reach the internal “Tracker” domain service. This tracker contains a repository with the list of all torrents. Each entry on the list contains two pieces of information:
- The statistics about that torrent: number of seeders, leechers and peers that have completed downloading.
- The peer list: a list of all the clients announcing the same torrent (swarm).
{
	"info_hash": "090c6d4fb3a03191c4ef1fda6236ef0efb2d5c10",
	"seeders": 1,
	"completed": 1,
	"leechers": 0,
	"peers": [
		{
			"peer_id": {
				"id": "0x2d71423030303030303030303030303030303031",
				"client": null
			},
			"peer_addr": "0.0.0.0:17548",
			"updated": 1709916034742,
			"updated_milliseconds_ago": 1709916034742,
			"uploaded": 0,
			"downloaded": 0,
			"left": 0,
			"event": "Completed"
		}
	]
}
The reason why we have been focusing on that part is because we think that’s the main bottleneck if we want to increase the number of requests the tracker can handle per second.
The announce request is the most important request a tracker needs to handle. Peers get the list of other peers from the tracker by making announce requests. The purpose of that request is:
- To include the peer making the request in the list of peers which are seeding or downloading the torrent.
- Return the list of other peers so that the client can start asking for torrent pieces to the other peers.
Every request is a write/read request. The system is intensive in writes. All requests eventually try to acquire a write lock to include themselves in the peer list. That’s why we think that’s the main bottleneck in our implementation, at the moment. For that reason we have been trying different implementations of the torrents repository:
pub type TorrentsRwLockStd = RwLockStd<EntrySingle>;
pub type TorrentsRwLockStdMutexStd = RwLockStd<EntryMutexStd>;
pub type TorrentsRwLockStdMutexTokio = RwLockStd<EntryMutexTokio>;
pub type TorrentsRwLockTokio = RwLockTokio<EntrySingle>;
pub type TorrentsRwLockTokioMutexStd = RwLockTokio<EntryMutexStd>;
pub type TorrentsRwLockTokioMutexTokio = RwLockTokio<EntryMutexTokio>;
pub type TorrentsSkipMapMutexStd = CrossbeamSkipList<EntryMutexStd>; // Default
pub type TorrentsSkipMapMutexParkingLot = CrossbeamSkipList<EntryMutexParkingLot>;
pub type TorrentsSkipMapRwLockParkingLot = CrossbeamSkipList<EntryRwLockParkingLot>;
pub type TorrentsDashMapMutexStd = XacrimonDashMap<EntryMutexStd>;
The default implementation used in production is TorrentsSkipMapMutexStd.
NOTICE: All implementations are based on types that support ordering like BTreeMap or SkipMap. The reason we use those types is because the tracker API has an endpoint where you can get the ordered list of all torrents in the tracker repository.
Internal Repository Benchmarking
As we explained in a previous article (”Benchmarking the Torrust BitTorrent Tracker”) you can run the benchmark for those different repository implementations with the following command:
cargo bench -p torrust-tracker-torrent-repositoryThe output at the time of writing this post is similar to:
     Running benches/repository_benchmark.rs (target/release/deps/repository_benchmark-a9b0013c8d09c3c3)
add_one_torrent/RwLockStd
                        time:   [63.057 ns 63.242 ns 63.506 ns]
Found 12 outliers among 100 measurements (12.00%)
  2 (2.00%) low severe
  2 (2.00%) low mild
  2 (2.00%) high mild
  6 (6.00%) high severe
add_one_torrent/RwLockStdMutexStd
                        time:   [62.505 ns 63.077 ns 63.817 ns]
Found 11 outliers among 100 measurements (11.00%)
  4 (4.00%) high mild
  7 (7.00%) high severe
Benchmarking add_one_torrent/RwLockStdMutexTokio: Collecting 100 samples in estimated 1.0004 s (10M iterationsadd_one_torrent/RwLockStdMutexTokio
                        time:   [98.440 ns 98.551 ns 98.660 ns]
Found 4 outliers among 100 measurements (4.00%)
  3 (3.00%) low mild
  1 (1.00%) high severe
add_one_torrent/RwLockTokio
                        time:   [107.84 ns 108.18 ns 108.54 ns]
Found 3 outliers among 100 measurements (3.00%)
  2 (2.00%) low mild
  1 (1.00%) high mild
Benchmarking add_one_torrent/RwLockTokioMutexStd: Collecting 100 samples in estimated 1.0001 s (8.7M iterationadd_one_torrent/RwLockTokioMutexStd
                        time:   [116.34 ns 116.48 ns 116.63 ns]
Found 2 outliers among 100 measurements (2.00%)
  1 (1.00%) high mild
  1 (1.00%) high severe
Benchmarking add_one_torrent/RwLockTokioMutexTokio: Collecting 100 samples in estimated 1.0005 s (6.9M iteratiadd_one_torrent/RwLockTokioMutexTokio
time: [143.39 ns 143.51 ns 143.63 ns]Profiling With Valgrind
“Valgrind is an instrumentation framework for building dynamic analysis tools”. In fact it’s a suite of tools. The tool we are going to use is callgrind which collects data that can be later visualized with kcachegrind.
Valgrind, coupled with Kcachegrind, offers a powerful profiling solution for in-depth analysis of BitTorrent tracker performance. By simulating cache behavior and collecting call graphs, developers gain valuable insights into code execution dynamics and potential optimizations.
In order to profile the UDP tracker you need to:
- Build and run the tracker for profiling.
- Make requests to the tracker while it’s running.
Build and run the binary for profiling with:
RUSTFLAGS='-g' cargo build --release --bin profiling \
   && export TORRUST_TRACKER_CONFIG_TOML_PATH="./share/default/config/tracker.udp.benchmarking.toml" \
   && valgrind \
     --tool=callgrind \
     --callgrind-out-file=callgrind.out \
     --collect-jumps=yes \
     --simulate-cache=yes \
     ./target/release/profiling 60
NOTICE: You should make requests to the services you want to profile. For example, using the Aquatic UDP load test.
After running the tracker with valgrind it generates a file called callgrind.out
that you can open with kcachegrind.
kcachegrind callgrind.out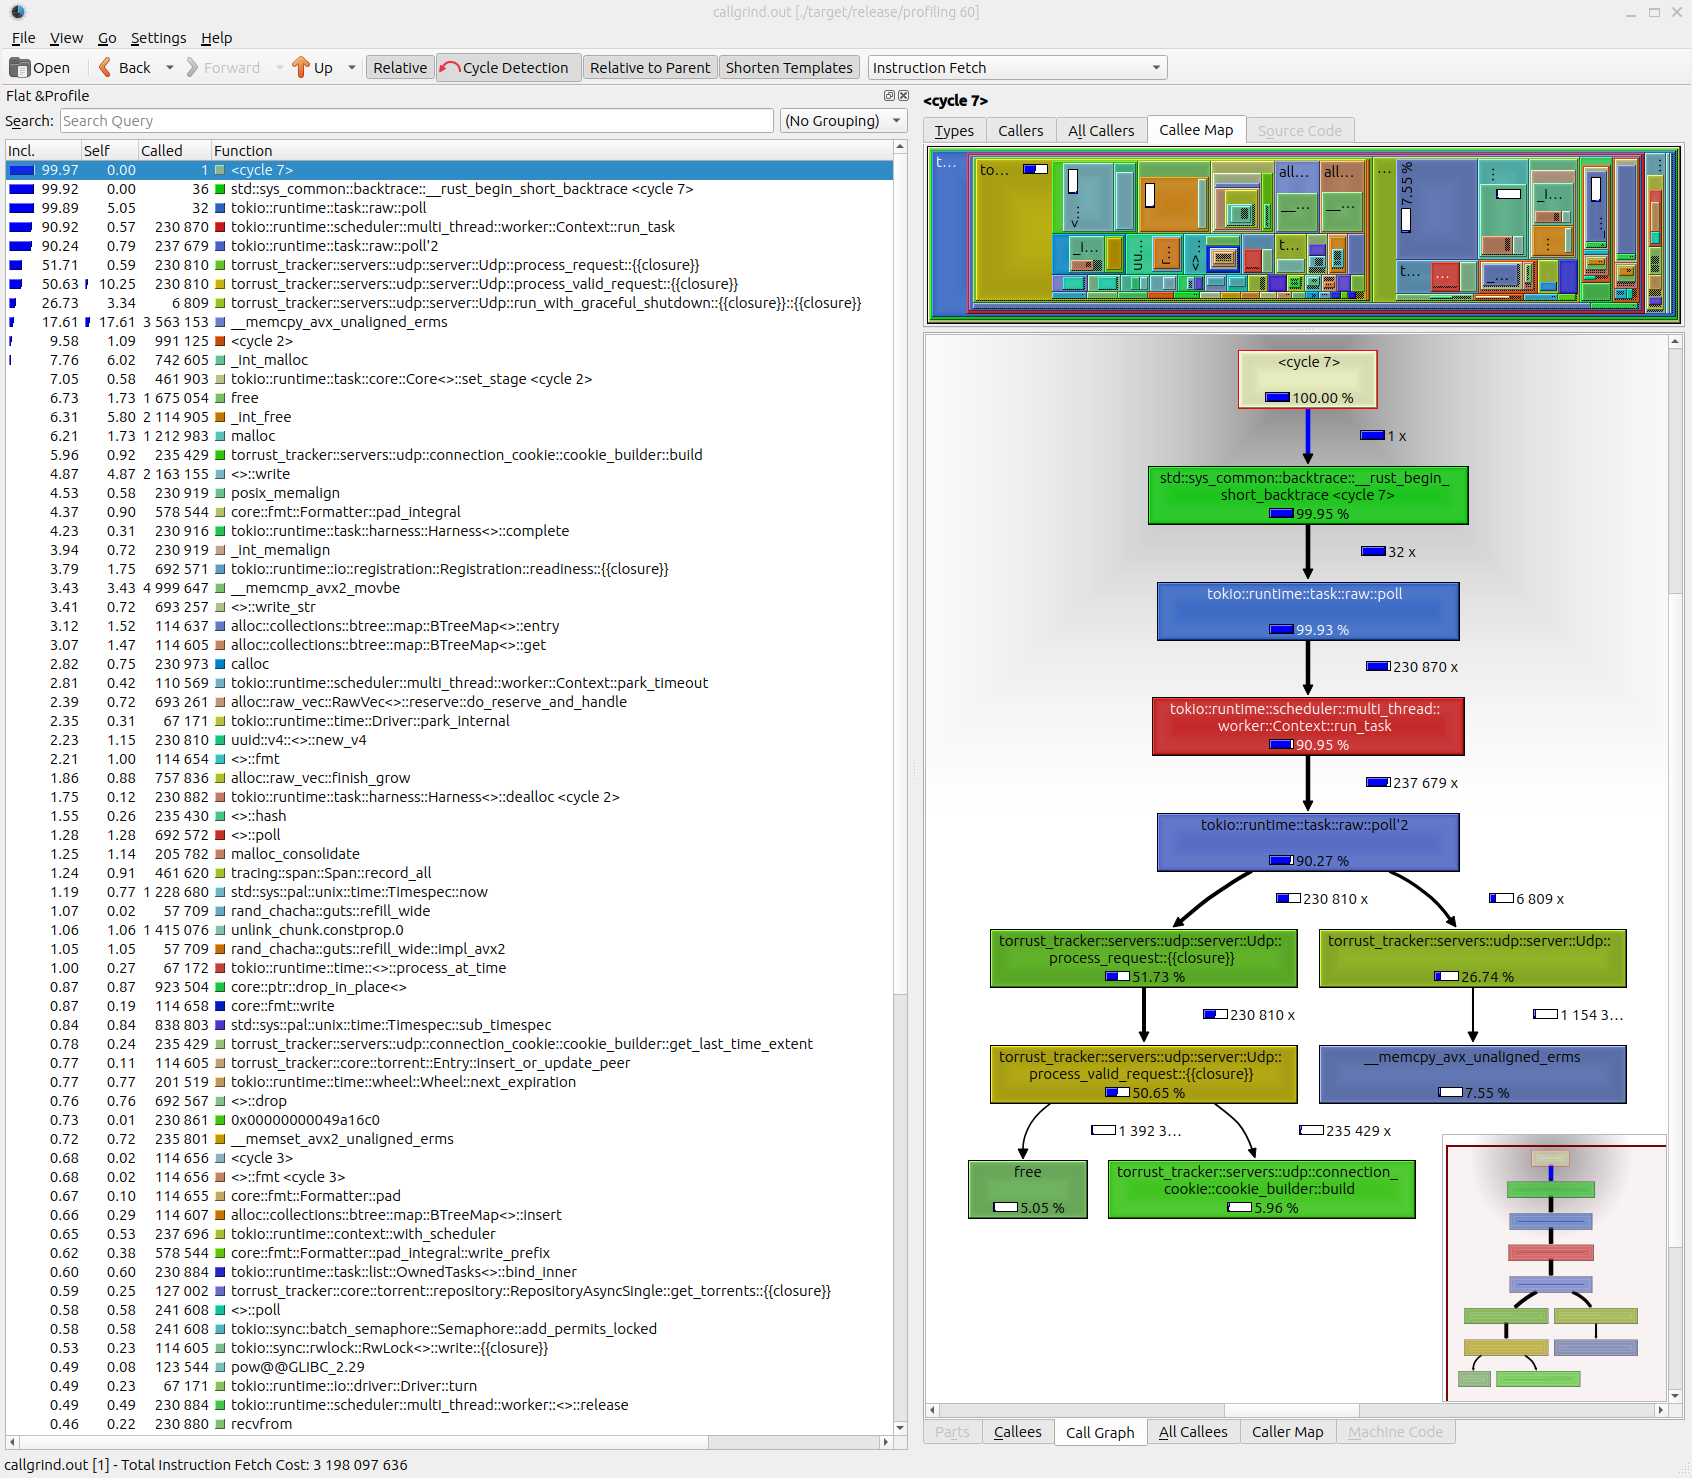
You have information like:
- How many times a function is called (
Calledcolumn). - The total amount of time spent running a function (
Incl.column). - The total amount of time spent running a function excluding child functions (
Selfcolumn). - Etcetera.
But one of the most interesting things it’s the interactive “Call Graph” where you can navigate through functions seeing how much time they spend.
The main problem with this tool is the asynchronous code. Functions executed in tokio spawned tasks are not shown directly. Since the Torrust Tracker makes an intense use of async code that makes it harder to reach conclusions from the tool.
There are alternatives that we have not tried yet:
- Use other tools like tokio-console.
- Insert your custom profiling functions in the code.
- Isolate the sync parts and profile them independently. For example, you could profile only the Torrent Repository or the Tracker domain Service.
Profiling With Perf
Another alternative for profiling are flamegraphs. There is a crate called cargo flamegraph that allows you to easily generate flamegraphs that you can visualize in a modern browser.
Flamegraphs offer a visual representation of code execution, providing invaluable insights into performance bottlenecks within the tracker codebase. By utilizing flamegraph profiling, developers can pinpoint hotspots and inefficiencies, guiding optimization efforts for enhanced performance.
After installing the cargo flamegraph package you can generate the flamegraph with:
TORRUST_TRACKER_CONFIG_TOML_PATH="./share/default/config/tracker.udp.benchmarking.toml" cargo flamegraph --bin=profiling -- 60Running the cargo flamegraph running the whole service produces a flamegraph like this:

Click here to see the interactive flamegraph.
As you can see, there are a lot functions for the tokio package but if you see at the top of the flame you will see the functions in the torrust_tracker namespace.
Conclusion
Although using these tools with async code can be very challenging at least you can use them to confirm if you are making an effort on improving the performance on the right place. And you can also detect parts very slow parts.
And as you can see more than 90% of the time is spent on the Tracker::announce method in these two functions:
Tracker::update_torrent_with_peer_and_get_stats.Tracker::get_torrent_peers_for_peer.
Which are the functions that need a lock to write and read in the Torrent Repository. Notice that it is the code we are focused on improving right now.
If you see something wrong or you want to contribute by:
- Adding new sections.
- Fixing typos.
- Making it clearer.
- Adding links.
- Or whatever you think that could be interesting to add,
If you have any questions or issues please open an issue in the corresponding repository:
- Torrust Tracker: https://github.com/torrust/torrust-tracker/issues
- Torrust Index: https://github.com/torrust/torrust-index/issues
- Torrust Website: https://github.com/torrust/torrust-index-gui/issues
- Torrust Compose: https://github.com/torrust/torrust-compose
- Containerizing Rust Applications Examples: https://github.com/torrust/containerizing-rust-apps-examples
We very welcome any contributions to the projects or this article.
Acknowledgments
Many thanks to Vitaly Bragilevsky and others for sharing the talks about profiling.
Links
Torrust Tracker Documentation for:
Profiling tools:
Talks about profiling:
- Profiling Rust Programs with valgrind, heaptrack, and hyperfine.
- RustConf 2023 - Profiling async applications in Rust by Vitaly Bragilevsky.
- Profiling Code in Rust - by Vitaly Bragilevsky - Rust Linz, December 2022.
- Xdebug 3 Profiling: 2. KCachegrind tour.
Concurrent hash table data structures:
Tools for profiling/debugging async code: